Python Plotting#
Note
Please see also the new project CoolPlot, aiming to build upon the routines in CoolProp for plotting.
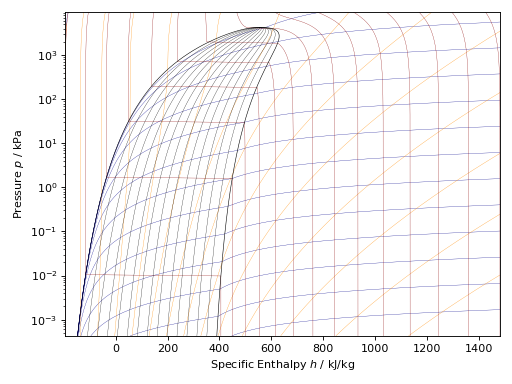
The simplest and most straight forward use case is the generation of plots with default isolines and spacing. Here is a brief example to demonstrate how to create a pressure-enthalpy (\(\log p,h\)) plot for propane (R-290) with automatic isoline spacing:
import CoolProp
from CoolProp.Plots import PropertyPlot
plot = PropertyPlot('R290', 'ph')
plot.calc_isolines()
plot.show()
(Source code, png, .pdf)
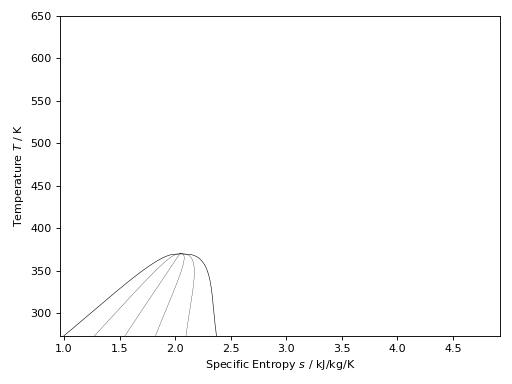
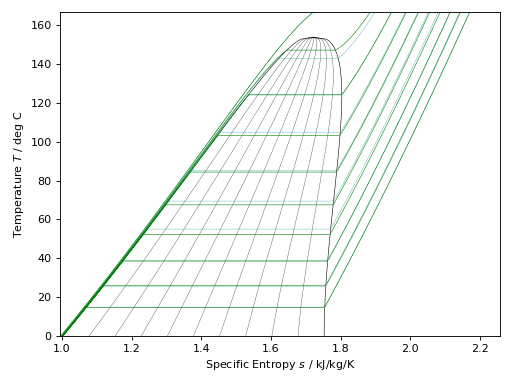
The following example can be used to create a temperature-entropy (\(T,s\)) plot for propane (R290) with isolines for the vapour quality in steps of 0.2:
import CoolProp
from CoolProp.Plots import PropertyPlot
ts_plot = PropertyPlot('R290', 'Ts', tp_limits='ORC')
ts_plot.calc_isolines(CoolProp.iQ, num=6)
ts_plot.show()
(Source code, png, .pdf)
The following example can be used to create a pressure-enthalpy (\(\log p,h\)) plot for R-134a with a couple of isotherms and isentropic lines:
import CoolProp
from CoolProp.Plots import PropertyPlot
plot = PropertyPlot('HEOS::R134a', 'PH', unit_system='EUR', tp_limits='ACHP')
plot.calc_isolines(CoolProp.iQ, num=11)
plot.calc_isolines(CoolProp.iT, num=25)
plot.calc_isolines(CoolProp.iSmass, num=15)
plot.show()
(Source code, png, .pdf)
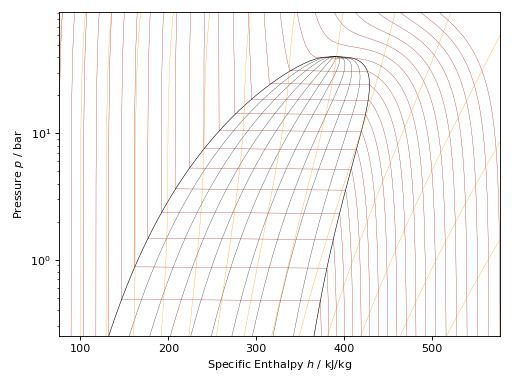
Here is an example for R-245fa using two different ways to generate the isobars:
import CoolProp
from CoolProp.Plots import PropertyPlot
plot = PropertyPlot('HEOS::R245fa', 'TS', unit_system='EUR', tp_limits='ORC')
plot.calc_isolines(CoolProp.iQ, num=11)
plot.calc_isolines(CoolProp.iP, iso_range=[1,50], num=10, rounding=True)
plot.draw()
plot.isolines.clear()
plot.props[CoolProp.iP]['color'] = 'green'
plot.props[CoolProp.iP]['lw'] = '0.5'
plot.calc_isolines(CoolProp.iP, iso_range=[1,50], num=10, rounding=False)
plot.show()
(Source code, png, .pdf)
The available plots are listed in the CoolProp.Plots.Common.Base2DObject
and at this time (May 2016) this list contains (\(T,s\)), (\(p,h\)),
(\(h,s\)), (\(p,s\)), (\(p,\rho\)), (\(T,\rho\)), (\(p,T\)) and
(\(p,u\)) plots.
Some of the commonly used Matplotlib functions,
such as title(), grid(), xlabel() and ylabel() have been wrapped in
the CoolProp.Plots.Common.BasePlot class to make the plotting of
graphs a little simpler, for example:
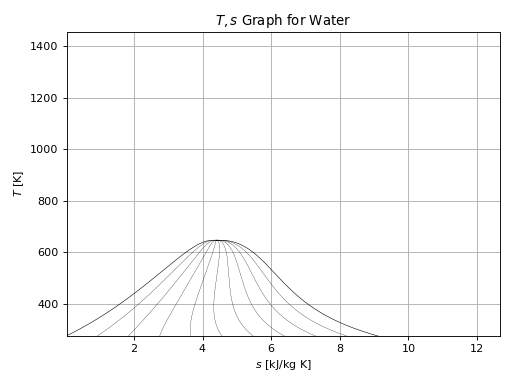
import CoolProp
from CoolProp.Plots import PropertyPlot
ts_plot = PropertyPlot('Water', 'Ts')
ts_plot.calc_isolines(CoolProp.iQ, num=11)
ts_plot.title(r'$T,s$ Graph for Water')
ts_plot.xlabel(r'$s$ [kJ/kg K]')
ts_plot.ylabel(r'$T$ [K]')
ts_plot.grid()
ts_plot.show()
(Source code, png, .pdf)