
Note
The python plotting API has been changed as of v4.0. Examples using the new python plotting API can be found here Python Plotting. Some backwards compatability was maintained, so the following example should still work.
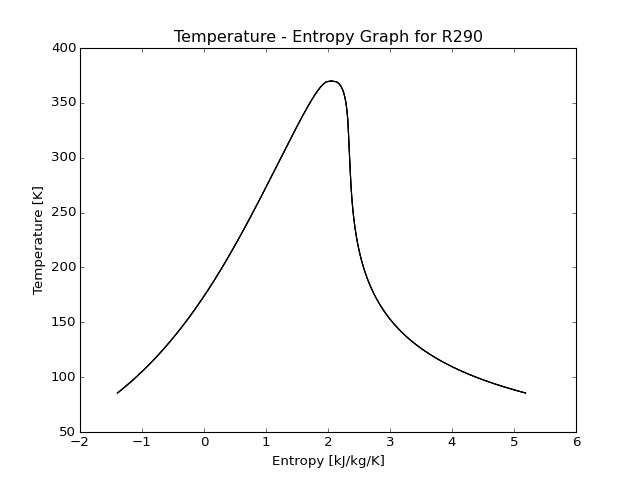
The following example can be used to create a Temperature-Entropy plot for propane (R290):
from CoolProp.Plots.Plots import Ts

Ts('R290', show=True)
(Source code, png)

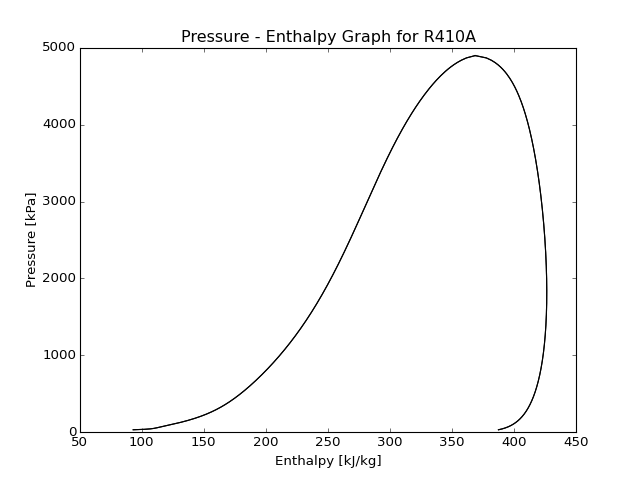
The following example can be used to create a Pressure-Enthalpy plot for R410A:
from CoolProp.Plots.Plots import Ph

Ph('R410A', show=True)
(Source code, png)

The available plots are:
| PT | Pressure-Temperature |
| Prho | Pressure-Density |
| Ph | Pressure-Enthalpy |
| Ps | Pressure-Entropy |
| Trho | Temperature-Density |
| Ts | Temperatre-Entropy |
| hs | Enthalpy-Entropy |
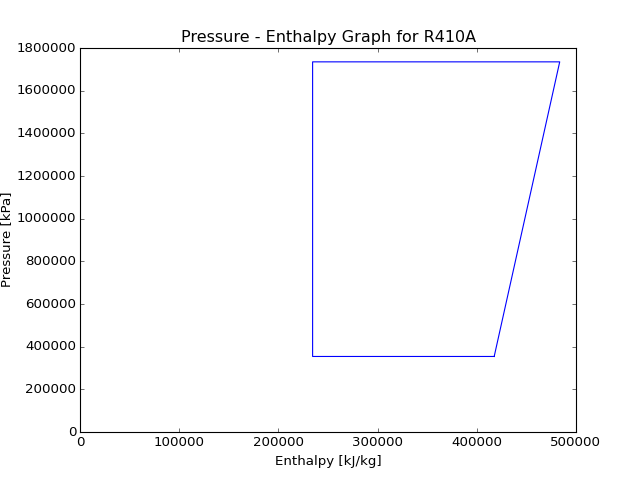
The following example will overlay a simple four-component cycle on a R410A Pressure-Enthalpy plot.
from matplotlib import pyplot
from CoolProp.Plots.Plots import Ph
from CoolProp.Plots.SimpleCycles import SimpleCycle

Ph('R410A')
SimpleCycle('R410A', 250, 300, 5, 5, 0.7)
pyplot.show()
(Source code, png)
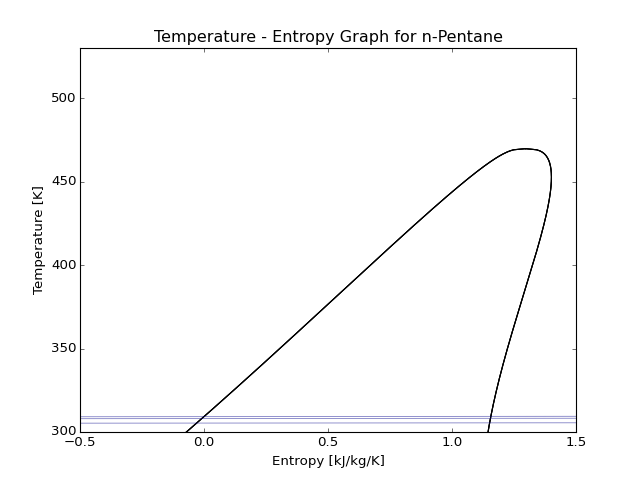
A more advanced example using built-in functions to draw lines of constant properties is given below. Note the different ways to invoke drawIsoLines:
from matplotlib import pyplot
from CoolProp.Plots.Plots import Ts, drawIsoLines

Ref = 'n-Pentane'
ax = Ts(Ref)
ax.set_xlim([-0.5, 1.5])
ax.set_ylim([300, 530])
quality = drawIsoLines(Ref, 'Ts', 'Q', [0.3, 0.5, 0.7, 0.8], axis=ax)
isobars = drawIsoLines(Ref, 'Ts', 'P', [100, 2000], num=5, axis=ax)
isochores = drawIsoLines(Ref, 'Ts', 'D', [2, 600], num=7, axis=ax)
#isenthalps = drawIsoLines(Ref, 'Ts', 'H', [100, 300], num=5, axis=ax)
pyplot.show()
(Source code, png)
